
Most known planets around other stars were found without seeing the planet itself. Astronomers saw a star dim slightly, or move slightly, and worked out what must be causing it. Each method measures some things about a planet and leaves others unknown, and a headline about a new Earth or signs of life can go further than the measurements behind it.
What a transit measures
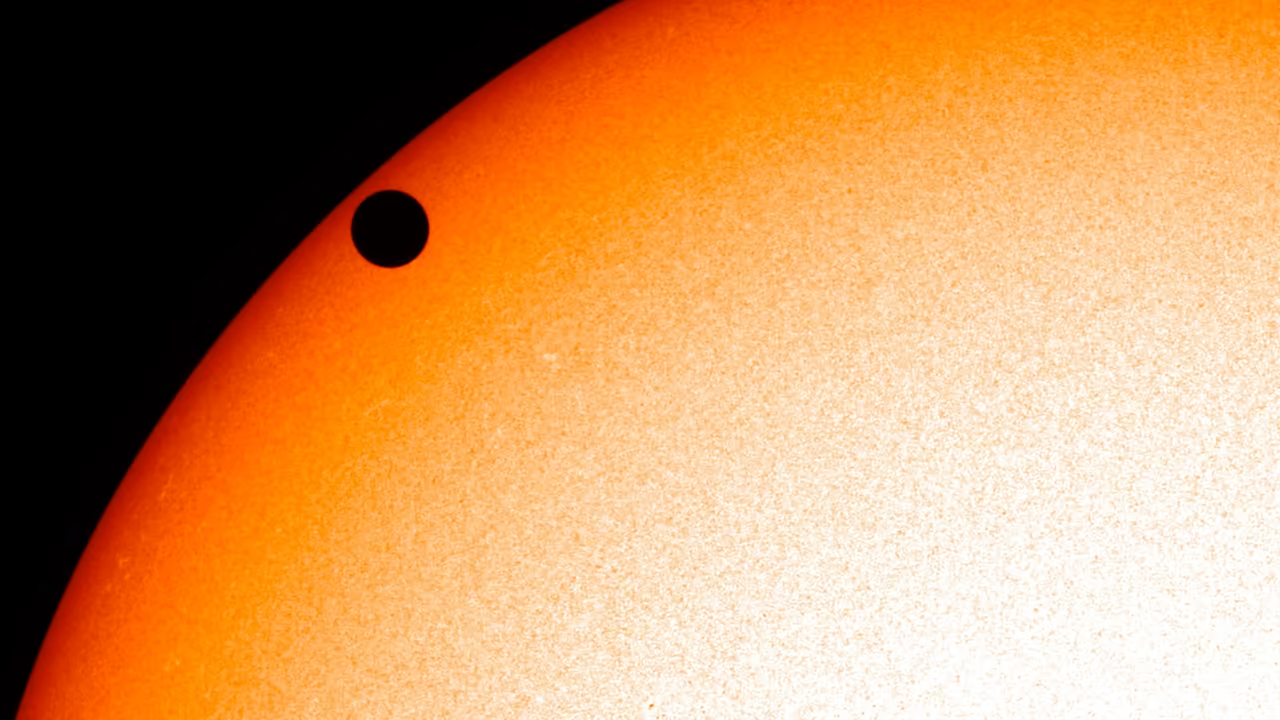
NASA’s exoplanet pages say that “most known exoplanets have been discovered using the transit method.” A transit happens when a planet passes between its star and us. The planet “ever so slightly dims” the star’s light, which shows up as a dip in a light curve, a graph of the star’s brightness over time.
NASA explains that “the size of the exoplanet’s orbit can be calculated from how long it takes to orbit once (the period)” and the star’s mass, and that “the size of the planet itself can be calculated based on how much the star’s brightness lowered.” A transit therefore gives a planet’s size and orbit. On its own, it does not give the planet’s mass.
What a wobble measures
The first planet found orbiting a star like the Sun, 51 Pegasi b in 1995, was found by a different method. NASA describes it as a gas giant in a four-day orbit that “tugged so hard on its parent star” that the star’s wobble could be measured. This “wobble method measures changes in a star’s ‘radial velocity’”: as the star moves slightly towards us and then away, the wavelengths of its light are “alternately squeezed and stretched.”
What the wobble usually gives is a minimum mass. The NASA Exoplanet Archive lists a quantity called M sin(i), which it describes as the “minimum mass of a planet as measured by radial velocity,” where i is the inclination, or tilt, of the planet’s orbit. The archive’s “best” mass column takes, “in order of preference,” the true mass, a mass corrected for a known tilt, or M sin(i), “depending on availability.” A reader who sorts that column is therefore comparing some true masses with some lower limits. The archive does flag which kind each value is, in a separate “provenance” column.
Candidates and false positives
A dip in starlight is not always a planet. Fressin and colleagues (2013) note that eclipsing binaries, pairs of stars that pass in front of each other, either in the background of the target star or physically bound to it, “can mimic the photometric signal of a transiting planet.” Using simulations compared with the Kepler candidates from the first six quarters of the mission, they estimated that “the global false positive rate of Kepler is 9.4%.” In their simulations the most common cause was not an eclipsing binary but a larger planet transiting a fainter companion star. It was highest for giant planets (6 to 22 times Earth’s radius), at 17.7%, lowest for small Neptunes (2 to 4 times), at 6.7%, and rose again to 12.3% for Earth-size candidates.
This is why a candidate is not counted as a planet until it has been checked. The NASA Exoplanet Archive includes an object as a planet only when “sufficient follow-up observations and validation have been undertaken to deem the possibility of the object being a false positive as unlikely,” among other criteria, including peer-reviewed publication.
The habitable-zone caveat
NASA defines the habitable zone as “the distance from a star at which liquid water could exist on orbiting planets’ surfaces.” A planet described as “in the habitable zone” orbits at such a distance. That does not mean the planet has water, an atmosphere or life.
Where the zone begins and ends is worked out with climate models. In a 2013 update of earlier estimates, Kopparapu and colleagues used a one-dimensional, cloud-free climate model. For their conservative estimate, they placed the inner edge at a “water-loss” limit and the outer edge at the “maximum greenhouse” warming that a carbon dioxide atmosphere can provide, and they also gave wider, less conservative limits. The conservative estimate suggested “that the present Earth lies near the inner edge.” They added: “Our model does not include the radiative effects of clouds; thus, the actual HZ boundaries may extend further in both directions than the estimates just given.”
Reading an atmosphere
When a planet transits, NASA notes, “some light will go through its atmosphere,” and that light can be analysed for the gases it passed through. NASA calls this “transit spectroscopy”; the papers below call the result a transmission spectrum. The case of K2-18 b shows how such claims are tested.
K2-18 b is a “habitable-zone sub-Neptune,” a planet smaller than Neptune. Its estimated temperature, worked out from the starlight it receives rather than measured, is about 250 K (about −23 °C). Madhusudhan and colleagues (2023) described it as a candidate “Hycean world,” a proposed class of “temperate ocean-covered worlds with H2-rich atmospheres” (hydrogen-rich). Using the James Webb Space Telescope (JWST) at near-infrared wavelengths, they reported detections of methane and carbon dioxide “at 5σ and 3σ confidence, respectively.” (Sigma, σ, expresses how unlikely a signal this strong would be if it were only noise; larger numbers mean stronger evidence.) They also said the spectrum suggested “potential signs of dimethyl sulfide (DMS),” a gas that has been proposed as a sign of life on such planets.
In 2025, the same team called that earlier DMS signal “a tentative hint” of “low statistical significance.” Using a different JWST instrument at mid-infrared wavelengths, they reported “new independent evidence for DMS and/or DMDS in the atmosphere at 3σ significance.” DMDS, dimethyl disulfide, is another possible sign of life. They wrote that “more observations are needed to increase the robustness of the findings.”
Independent teams then reanalysed the data. Schmidt and colleagues (2025) reprocessed the near-infrared spectra using “60 different data treatments and over 250 atmospheric retrievals.” They confirmed methane, but found “no statistically significant or reliable evidence for CO2 or DMS,” and showed that their revised composition “can be explained by an oxygen-poor mini-Neptune without requiring a liquid water surface or life.” Luque and colleagues (2025) analysed the near- and mid-infrared data together for the first time and found “insufficient evidence for the presence of DMS and/or DMDS.” They attributed “any marginal preferences” to “limiting the number of molecules considered in the model and oversensitivity to small changes between data reductions.” Using their best-fitting model with DMS and/or DMDS, they estimated that “∼25 more MIRI transits” (observations with the mid-infrared instrument) would be needed to rule out a flat, featureless mid-infrared spectrum at 3σ.
In a 2026 follow-up, Pica-Ciamarra, Madhusudhan and colleagues tested 661 molecules against a model with only methane and carbon dioxide, using Bayes factors, reported as their natural logarithm (ln B), which compare how well the data support one model over another. “Only DMS consistently results in Bayes factors ln B ≥ 2.0 across the datasets considered independently,” they reported, though in the near-infrared data this “depends on detector offsets.” The authors explain that this threshold “is motivated by the conventional threshold of ln B ≥ 2.5 for moderate preference, allowing for an empirical uncertainty of 0.5.” They added that “a few other gases also provide comparable fits to a subset of the data or only with some of the retrieval codes used, but with limited known plausible sources,” and called for further observations to tell possible trace gases apart.
Later in 2026, Binet, Madhusudhan and colleagues compared the mid-infrared spectra of ten planets. They reported “hints of complex molecules” in K2-18 b and two other temperate sub-Neptunes, TOI-732 c and TOI-270 d, “but not in the other seven planets,” judged the features “likely due to molecular absorption rather than instrument systematics or noise,” and wrote that “more observations are required to robustly identify the specific molecules.”
INSTAR’s research interest
INSTAR’s interest is in the questions a careful reader can ask before relying on an exoplanet headline. Was the planet’s size measured, its mass, or both? Is the mass a true mass or a minimum? Is the object a confirmed planet or a candidate, and how were false positives ruled out? Does “habitable zone” refer to a model’s estimate of distance, or to something observed on the planet? For an atmosphere claim, how strong is the evidence, and does it survive when other teams process the same data differently?
These questions connect to the outer space program page, which shows how the reliability of Kepler’s automated candidate list falls for faint, long-period signals. The brief on brain scan studies looks at what happens when many teams analyse the same data, and the page on how this site checks a fact describes the checks applied to the sources cited here.