
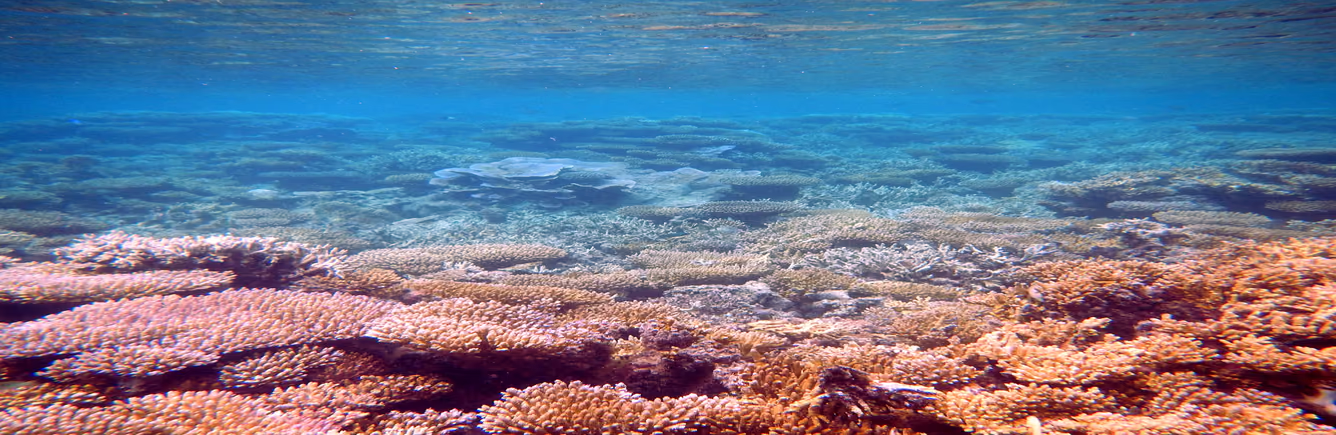
A colour-coded map of the world’s reefs looks like a picture of damage. What it shows is heat: how much hotter than usual the sea surface has been, and for how long. That is the condition known to drive mass coral bleaching, but it is not the same thing as bleaching, and the scientists who publish the maps say so.
What the satellite measures
When corals are stressed by conditions such as water that is too warm, NOAA’s National Ocean Service explains, “they expel the symbiotic algae living in their tissues, causing them to turn completely white.” It adds: “When a coral bleaches, it is not dead,” although bleached corals are under more stress and are subject to mortality. Warm water is not the only cause: NOAA lists runoff and pollution, which can bleach near-shore corals, and exposure to the air during extreme low tides, which can bleach shallow corals. Strong sunlight adds to bleaching in shallow-water corals when temperatures are high.
NOAA Coral Reef Watch starts from sea-surface temperature measured by satellites. Its temperature record provides “a measurement of the nighttime ocean temperature at the sea surface, calibrated to 0.2 meters depth,” on a grid of 5 km squares, updated daily. Night-time readings are used to reduce the effect of daytime solar heating and glare. NOAA notes that data from any single 5 km pixel “may be less representative of a region’s thermal conditions,” and that its temperature anomalies are less reliable at high latitudes, where persistent cloud limits the satellite data.
From temperature to heat stress
Coral Reef Watch then compares each day’s temperature with the Maximum Monthly Mean: “the warmest of the 12 monthly mean climatology values” for that grid square, in other words the usual temperature of its hottest month. The difference is called a HotSpot. A HotSpot of 1 °C or more is treated as the bleaching threshold.
The Degree Heating Week (DHW) adds up those HotSpots of 1 °C or more over a running 12-week window, so it measures both how hot and how long. It is expressed in °C-weeks. NOAA states that “DHWs over 4 °C-weeks have been shown to cause significant coral bleaching; values over 8 °C-weeks have caused severe bleaching and significant mortality.” Those thresholds come from experience: field observations from scientific surveys and informal monitoring “have indicated that there is a correlation with reef-wide coral bleaching when the DHW value reaches 4 °C-weeks.”
The Bleaching Alert Area map turns the two numbers into levels, from No Stress through Bleaching Watch and Warning to Alert Levels 1 to 5. On 15 December 2023 NOAA added Alert Levels 3, 4 and 5 starting at 12, 16 and 20 °C-weeks of heat stress, after extreme heat stress in 2023 that was “confirmed by in-water observations.” Every alert level is described as a risk: Alert Level 1 is “Risk of Reef-Wide Bleaching,” and Alert Level 5 is “Risk of Near Complete Mortality (> 80% of corals).”
Heat stress is not bleaching
NOAA’s summary of the fourth global coral bleaching event, published in June 2026, shows the difference in its own wording. From early 2023 to mid-2025, “bleaching-level heat stress impacted 84% of the world’s coral reef area” in the Pacific, Atlantic and Indian Oceans, and mass bleaching “was documented in at least 83 countries and territories.” The first figure is about heat; the second is about bleaching that people observed. The same summary notes that “not all coral reef areas bleached even when exposed to high ocean temperatures,” and that scientists are studying those places to learn why.
Deciding that the event had ended also took reports from the water. Derek Manzello, Coordinator of Coral Reef Watch, said NOAA needed to confirm “that no widespread, large-scale bleaching was reported anywhere” during the austral summer of December 2025 to February 2026, and that “[t]he plan moving forward is to rely on field bleaching observations to determine if and when global events are happening.”
What field surveys added
Two studies show what long-term records and surveys of reefs can add. Hughes and colleagues (2017) combined aerial and underwater surveys of Australian reefs with satellite-derived sea-surface temperatures. They found that the distinctive geographic footprints of bleaching on the Great Barrier Reef in 1998, 2002 and 2016 “were determined by the spatial pattern of sea temperatures in each year.” Water quality and fishing pressure had minimal effect on the 2016 bleaching, and past exposure to bleaching in 1998 and 2002 did not lessen its severity.
Hughes and colleagues (2018) analysed bleaching records at 100 reef locations around the world from 1980 to 2016. The median time between pairs of severe bleaching events had fallen steadily since 1980 and was “now only 6 years,” which the authors describe as too short for a full recovery of mature coral assemblages.
INSTAR’s research interest
INSTAR’s interest is in the questions a careful reader can ask before treating a heat-stress map as a report on a reef. Is the number heat stress or observed bleaching? Over what area and grid size, and at what depth was the temperature measured? Which version of the alert levels is in use? Has anyone surveyed the reef itself, and when?
These questions connect to the ocean science program page, which describes how ocean temperatures are measured below the surface by profiling floats. The brief on wearable heart-rate readings asks a similar question about a different sensor: what a reading estimates, and what it does not observe directly. The page on how this site checks a fact describes the checks applied to the sources cited here.